


As we continue to talk about investing, we need to consider the investment risks. There are all kids of risk inherent in investing. Obviously the risk is that we will lose money on the investment but there are so many factors that cause an investment to lose value, it is hard to evaluate all of them. Volatility is the term investment managers use to talk about investment risk. The definition per investopedia is: “A statistical measure of the dispersion of returns for a given security or market index. Volatility can either be measured by using the standard deviation or variance between returns from that same security or market index. Commonly, the higher the volatility, the riskier the security. [emphasis added] The “dispersion of returns” means basically, how wide is the range between the best return and the worst? If that is a big range, there is the potential for downside risk as well as upside reward.
[Read more: Volatility Definition | Investopedia http://www.investopedia.com/terms/v/volatility.asp#ixzz3l4QYQksc ]
Here is an excerpt from The Graduate’s Guide to Money which talks more about “seeing” the risk of an investment.
How do you know how much risk an investment has?
Investing involves a spectrum of risk, from very conservative (a bank deposit) to very aggressive (junk bonds and speculative investments). You have to take on some risk to earn enough interest to beat inflation and to get a better return on your investments. Higher risk means higher potential return because you also have potential to lose the money. Low risk, low return just doesn’t work for long-term purchasing power.
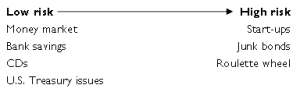
Every other kind of asset (investment) falls somewhere between the two extremes. Figure 1 is a graph from www.finance.yahoo.com that shows what volatility looks like for some asset classes. Notice how the prices fluctuate in the short-term but seem to smooth out over very long time periods.
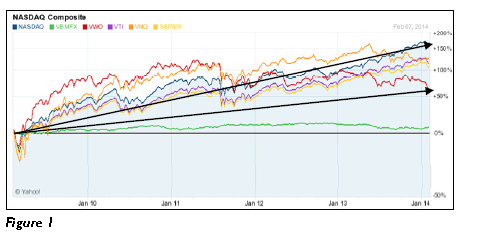
See how all of the lines at the top are little roller coasters? Up, down, up, down. That is volatility. The black straight line demonstrates that, despite all of the drama of daily volatility, over the last five years, the market has gone up; it just covered a lot of ground in between. That’s why your time frame is so critical. Figure 2 shows a longer time frame:
Viewing the same investments since 1970 illustrates that the drama of the volatility gets smoothed out. That is what you have to think about when you invest — the long upward climb that the market takes. You can’t worry about the little dips and the intermediate peaks and valleys along the way. Keep your eye on the summit and ignore the swings in the middle.
The other thing to notice is the correlation, or the tendency for investments to move in the same direction at the same time. Notice in Figure 3 how all the lines (except green) mirror each other, but not to the same extreme and not at exactly the same time, but close.
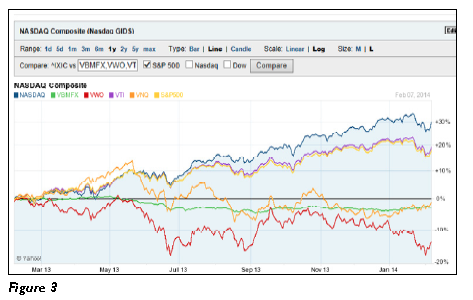
As one drops, they all seem to drop. That means that they are positively correlated. When you have positive correlation, you aren’t truly diversified. In other words, your investments are all on the same roller coaster. You can be diversified across countries, industries, or individual companies, but if everything is positively correlated, it isn’t helping to reduce the volatility of your investment portfolio. Ideally, you want some investments that are negatively correlated so that if one is going down, the other goes up. That levels out the impact on the total portfolio.
End Excerpt.
So, if you want to really “see” what kind of ride your investment is likely to take you on, look at the charts section of www.finance.yahoo.com and compare your investment selection to an index (like the S&P 500, Nasdaq, etc.) or to another investment. If the 2 investments are “on the same ride,” you can expect your portfolio to have more ups and downs. If they tend to move opposite of one another, you will have a smoother ride when those investments are combined.
Take a look at the history and spread out the time frame to see how it has performed over a longer period of time. There is definitely fluctuation in pricing on a daily basis but consider the risk that you would totally lose your investment. If you pick an index mutual fund, your risk of total loss is probably low; however, your risk of price fluctuation may still be high. The key, then, is not to sell when the price is low; that’s when you buy.
Keep in mind that if you are looking at investment options within a 401k, they may not give you a ticker as these plans sometimes create their plan funds internally but base them on established mutual funds. Search the name and see if you can find something close and you can compare past returns for the 401k fund to the returns per the fund that actually trades. Finding one that is close should give you the information that you need.
It is easy to pick a mutual fund and chart it, watch it over time and get a feel for how it does. You can “paper” invest with no fear! Start trying it out; this is how you learn. Then when you better understand how a couple of funds perform, you can start to invest with money and know what you are getting into.
To your financial success!